

The Kinky Interest Rate Model (IRM) brings a fresh approach to how interest rates respond to utilization levels, offering improved capital efficiency and stability for lenders and borrowers.
Date
Topic
DeFi

The Kinky Interest Rate Model (IRM) brings a fresh approach to how interest rates respond to utilization levels, offering improved capital efficiency and stability for lenders and borrowers.
Ideated and developed by Euler, and implemented by Telos within its Trevee markets on Plasma and Almanak markets on Ethereum mainnet, the Kinky IRM represents an evolution beyond traditional mechanisms.
Unlike traditional linear kink models, the Kinky IRM features a logarithmic shape after the "kink" point, enabling steeper yet adaptable rate changes at high utilizations. This article explores its mechanics, benefits, and insights from a visual simulation.
Understanding the Interest Curve
In lending systems, interest rates are set by the IRM based on utilization, the ratio of borrowed to supplied assets. The role of the curator is crucial here, as they help maintain market health by setting parameters that balance supply and demand, preventing extreme volatility. Traditional models use piecewise-linear curves: rates rise gradually until the "kink," then increase sharply to maintain liquidity.
 |
|---|
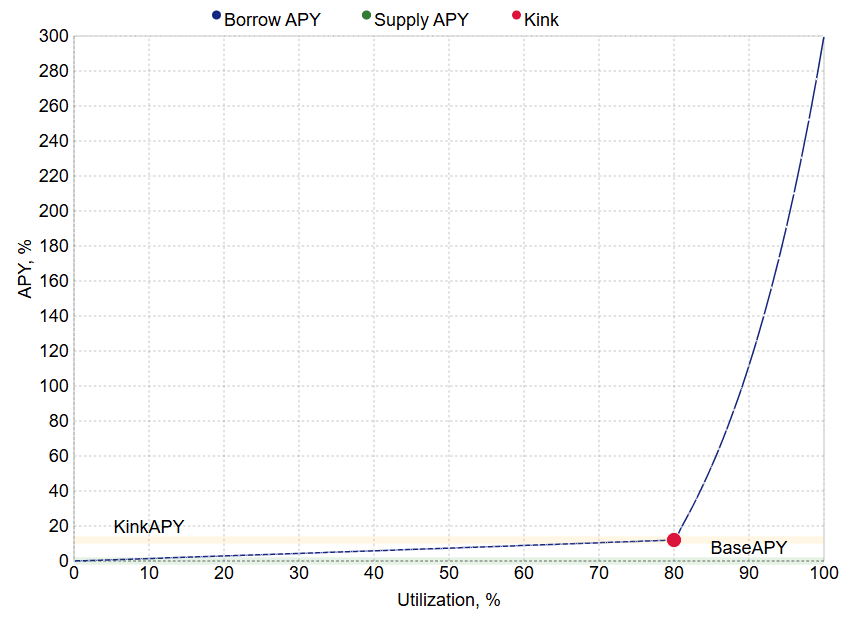
Rapid Borrow APY Increase after Kink Point at 80% Utilization Rate |
The Kinky IRM replaces the linear post-kink rise with a logarithmic curve, making rate increases steeper but more responsive to liquidity conditions. This enables borrowers to access greater capital at lower costs, while allowing lenders to earn stable, competitive yields without abrupt fluctuations that could compel borrowers to close positions or repay loans to avoid liquidation.
This visualization, from an IRM simulator, highlights the sharper logarithmic curve after the kink.
 |
|---|
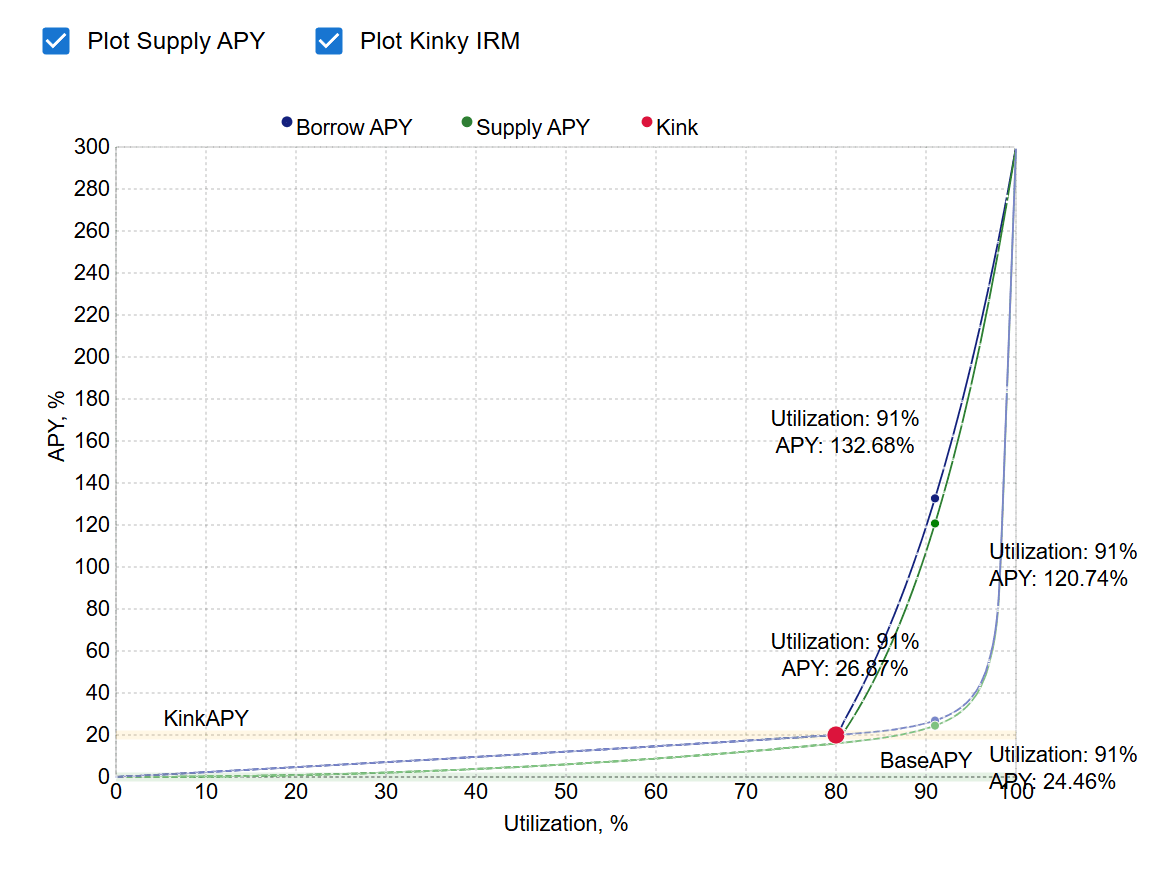
Kinky Interest rate curves, showcasing the Kinky IRM's logarithmic tail versus Classic Jump Rate model. |
The accompanying graph plots Borrow APY, Supply APY, and the kink point against utilization (0% to 100%) and APY. At low utilizations, the curves rise slowly. After the kink (91% here), Borrow APY hits 132.68%, and Supply APY reaches 120.74% with the Classic IR Curve. But with Kinky IR Curve, at the same Utilization Rate (91%), Borrow APY hits 24.46%, and Supply APY reaches 26.87%, showing the model's baseline efficiency.
Key Benefits of the Kinky IRM
The Kinky IRM improves high-utilization scenarios. Here’s how:
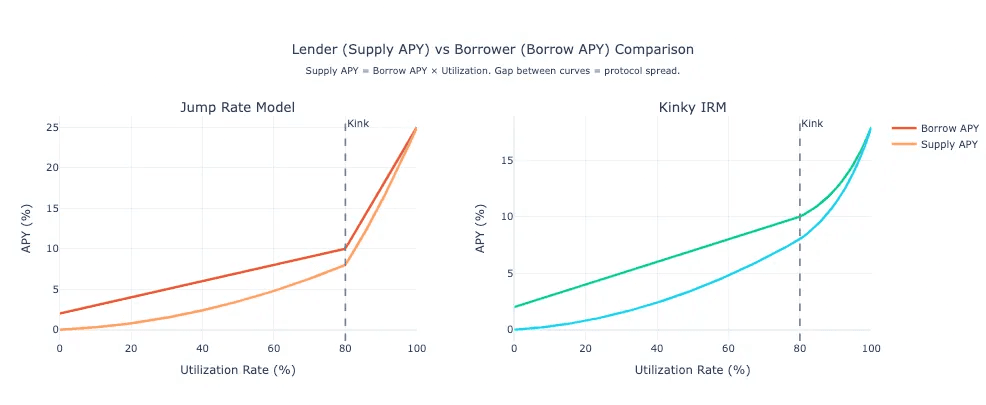
Borrow more for cheaper: The logarithmic tail keeps borrowing costs responsive but not excessively high, making it 3.4x more efficient for borrowers at high utilization compared to linear models.
Lend more without upsetting borrowers: Lenders earn higher yields as utilization rises, but the curve avoids rate squeezes, ensuring borrowers aren’t deterred by sudden hikes. The smoother kink transition aids rate discovery and liquidity distribution.
Incentives to avoid rate squeezes: The steeper rise discourages over-borrowing when liquidity is tight, benefiting both lenders and borrowers by reducing volatility risks.
Higher capital efficiency: The logarithmic scaling maximizes lender returns while keeping borrowing affordable, supported by tools for careful capital allocation.
Compared to the Jump Rate Model, which doubles rates linearly post-kink, the Kinky IRM’s logarithmic tail offers a 30% lower cost increase at 95% utilization, per simulator estimates. This also reduces liquidation risks, as borrowers can adjust positions before rates spike uncontrollably.
Quantitative Details and Practical Examples
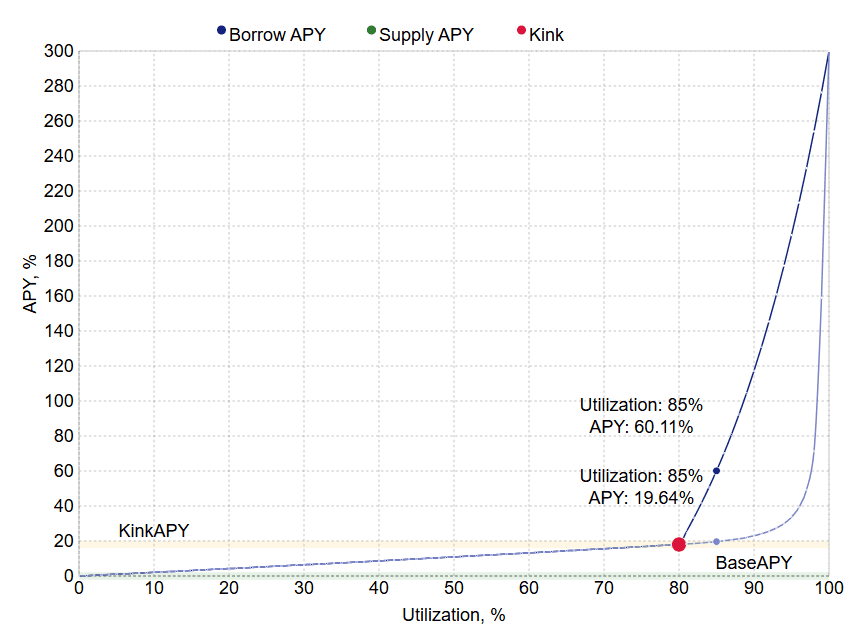
The Kinky IRM’s efficiency can be quantified. At 85% utilization, the Jump Rate Model might push Borrow APY to 60%, while the Kinky IRM limits it to approximately 20% due to its logarithmic scaling (calculated as APY = Base APY × e^(k × (U - U_kink)), where k is the steepness factor, U is utilization, and U_kink is the kink point).
This difference saves borrowers about 40% in interest costs.
 |
|---|
Jump Rate Model vs Kinky Rate Model at 85% utilization Rate (kink at 80%). |
For a practical example, consider a borrower with $10,000 at 85% utilization. Under the Jump Rate Model, they’d face $600 in annual interest (60% APY), but with the Kinky IRM, this drops to $200 (20% APY), freeing up $400 for reinvestment.
A key difference lies in the dynamics of the two models. With the Jump Rate Model, at 60% APY, borrowers face high interest costs, often forcing them to repay their debt quickly or risk liquidation. This demands a much more active management of their positions, including frequent monitoring and adjustments to avoid over-leveraging or sudden liquidations. In contrast, the Kinky IRM provides greater long-term stability for both borrowers and lenders. Its logarithmic tail ensures that as borrowing demand increases, the interest rates rise gradually and predictably, allowing borrowers to maintain affordable costs without constant repositioning. Lenders, meanwhile, enjoy consistent yields that align with market conditions, avoiding the sharp spikes that could disrupt their returns.
This balance makes the Kinky IRM a more sustainable option, fostering a mutually beneficial environment where both parties can thrive even as utilization grows.
Liquidation Risk Zones
 |
|---|
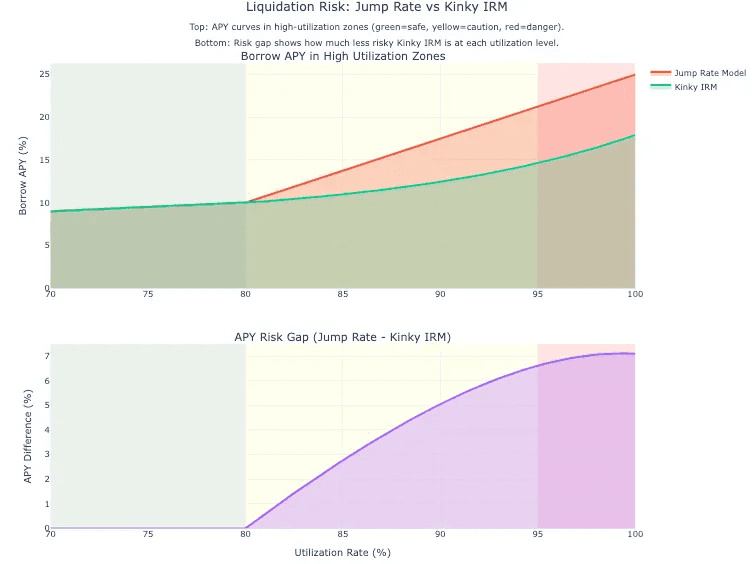
This visualization maps borrow APY growth across utilization zones (green=safe, yellow=caution, red=danger) with the bottom panel isolating the APY gap between models. |
Both curves remain identical in the safe zone, but diverge significantly after the kink point. Jump Rate's steeper post-kink slope pushes borrowers into dangerous APY territory faster. The risk gap widens exponentially in high-utilization scenarios—precisely when liquidation risk is highest. Kinky IRM's logarithmic tail keeps rates substantially lower in the danger zone, providing a critical safety buffer. This structural difference means borrowers using Kinky IRM can operate closer to capacity without triggering the rate spikes that force position closures or liquidations.
 |
|---|
Liquidation Risk: Jump Rate vs Kinky IRM |
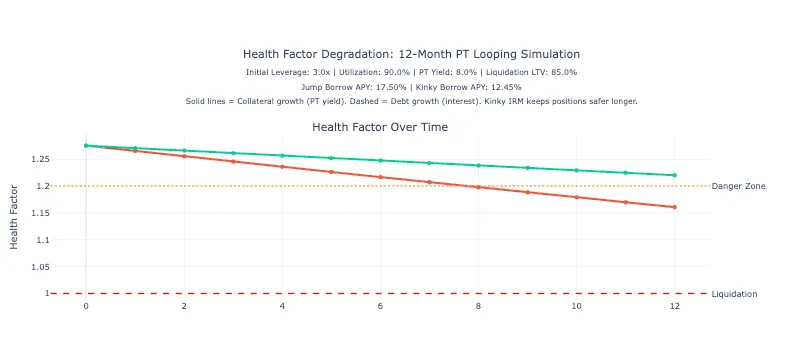
Health Factor Degradation: PT Looping Simulation
This simulation tracks health factor decay over 12 months for a 3x leveraged PT looping position at high utilization. Solid lines show collateral growth from PT yield, while dashed lines track debt accumulation from interest payments.
Jump Rate's higher borrow APY causes debt to compound faster, degrading health factor more aggressively. The curve crosses into the danger zone and trends toward liquidation threshold by month 12. Kinky IRM maintains a healthier trajectory throughout, with slower debt growth keeping the position comfortably above dangerous levels. The divergence illustrates how Kinky IRM's lower rates provide crucial breathing room for leveraged strategies, allowing positions to remain viable longer without requiring active deleveraging or additional collateral injections.
 |
|---|
Health Factor Degration |
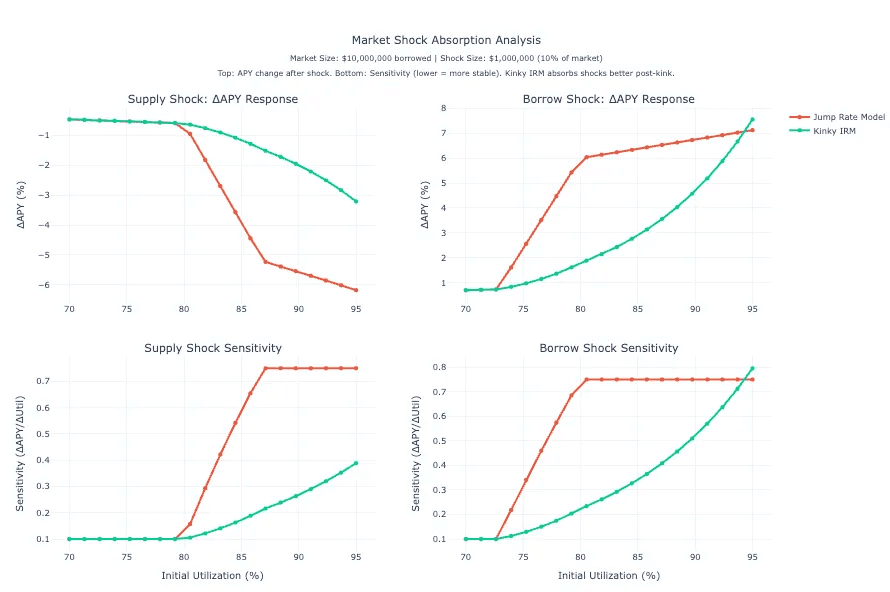
Market Shock Absorption Analysis
This analysis simulates a $1M market shock (10% of market size) across different utilization levels, measuring both APY response magnitude and sensitivity. Top panels show absolute APY changes, bottom panels show sensitivity (rate of change per utilization point).
Jump Rate exhibits extreme sensitivity spikes at the kink point, where even small shocks trigger dramatic rate changes. Post-kink, Jump's sensitivity remains elevated and volatile. Kinky IRM maintains consistently lower sensitivity across all utilization levels, with gradual rather than abrupt transitions. For supply shocks, Kinky absorbs the impact more smoothly, preventing the sharp rate drops that could destabilize lender returns. For borrow shocks, Kinky's dampened response reduces panic-induced position closures. This structural stability makes Kinky IRM particularly valuable during volatile market conditions, where it acts as a shock absorber rather than an amplifier of market stress.
 |
|---|
Market Shock Absorption Analysis |
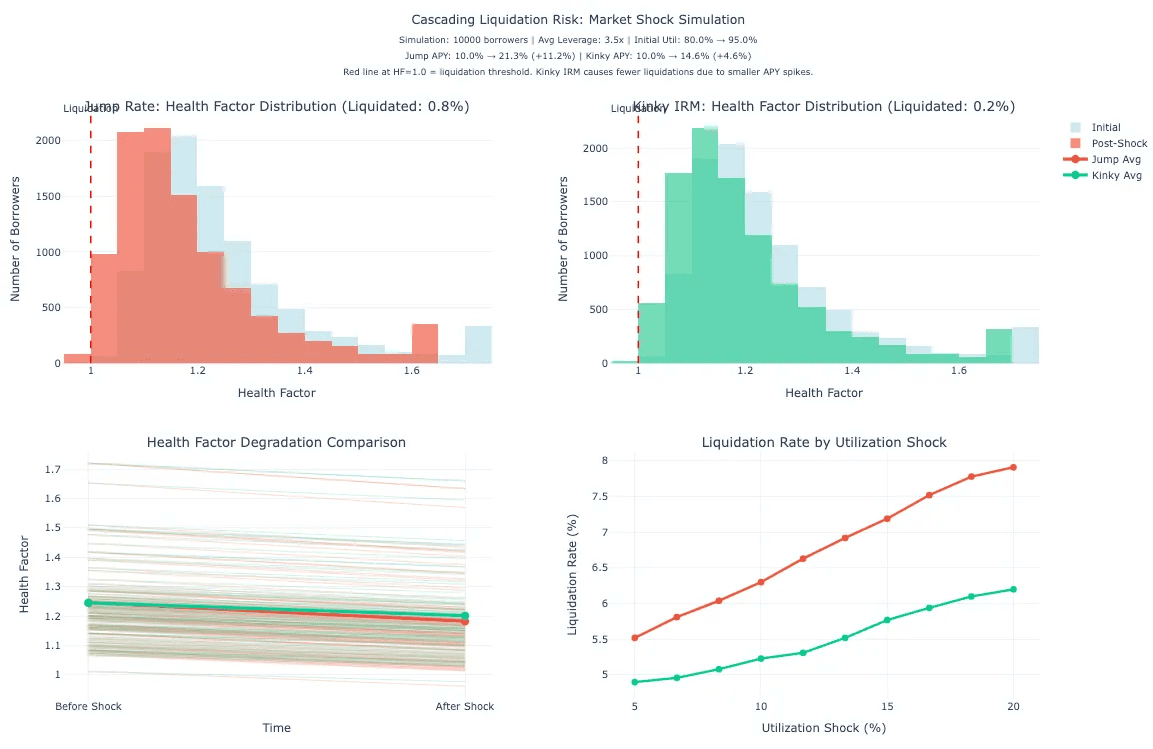
Cascading Liquidation Risk: Market Shock Simulation
This Monte Carlo simulation tracks 10,000 borrowers through a severe market shock (utilization jumping from 80% to 95%). Top panels show health factor distributions before and after shock, with the red liquidation threshold at 1.0. Bottom left traces individual borrower trajectories, while bottom right plots liquidation rates across shock magnitudes.
Jump Rate's steeper APY spike causes significantly more health factor degradation, pushing a larger portion of the distribution below the liquidation threshold. The liquidation rate curve reveals Jump's vulnerability scales non-linearly with shock severity. Kinky IRM's logarithmic structure dampens the APY response, keeping most borrowers safely above liquidation even during extreme stress. The gap widens as shocks intensify—precisely when systemic stability matters most. This demonstrates how Kinky IRM's curve geometry isn't just about lower rates, but about preventing cascading failures that could destabilize entire lending markets during black swan events.
 |
|---|
Cascading Liquidation Risk in a Market Shock Simulation. |
Risk Management
The Kinky IRM shifts risk management dynamics. For users, the logarithmic tail makes them less sensitive to large inflows or outflows, helping maintain Total Value Locked (TVL) by smoothing rate changes. Curators benefit by having a tool to set parameters that prevent over-borrowing, but they must actively monitor utilization to avoid misconfigurations. The model’s steepness requires precise tuning, poorly set parameters could lead to slower reactions, potentially destabilizing the market if utilization spikes unexpectedly.
Ready to deploy Kinky IRM in your markets?
Follow @TelosConsilium on X for real-time updates, parameter guides, and live simulations.
Or click the Schedule Consultation button (top-right on this site) to explore custom IRM tuning with the Telos team.
Related articles

TeloSkills: A Free Web3 Due Diligence Skill for Claude

Coinshift USPC & iUSPC - Comprehensive Due Diligence

MainStreet – Comprehensive Due Diligence
Introducing the Kinky IRM: Enhancing Interest Curves

Risk Curation Methodology for DeFi Yield Optimization

Meet IRMaster, The Effortless Interest Rate Manager for Liquity v2 & Forks

Stablecoins as Collateral: Pricing Guidelines
Stablecoins as Collateral: Pricing Guidelines
Meet IRMaster, The Effortless Interest Rate Manager for Liquity v2 & Forks
